THE MONTH AT A GLANCE
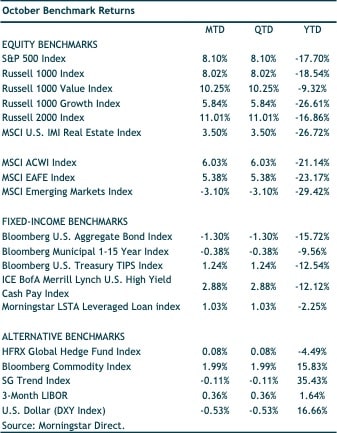
- Following a nearly 13% loss in the previous two months, US stocks surged 8.1% higher in October
- Higher rates led to a loss of 1.3% for US core bonds
- Value stocks outperformed—nearly doubling the return of growth stocks
- Emerging-markets equities underperformed, largely due to continued weakness in Chinese markets
MARKET RECAP
Hopes that the Federal Reserve might soon ease off their restrictive stance helped propel equities higher in October. The Dow Jones Industrial Average (which is tilted more towards value stocks) jumped 14.1%—its best month since January 1976. The more tech/growth-oriented NASDAQ Composite was also positive, but with a smaller 3.9% gain. The S&P 500 gained 8.1% in October, narrowing its year-to-date loss to 17.7%. (The market’s hope that a Fed pivot might be in the works was largely dashed as of this writing. More on the November FOMC meeting below.)
Developed international and emerging-markets equities underperformed US stocks in October. MSCI EAFE gained a solid 5.4% in the month. However, emerging-markets stocks returns were dragged lower by Chinese equities and notched a loss of 3.1% in October. The MSCI China Index had a notable decline of 16.8% in October. Much of that fall happened on October 24th, the first trading day following the end of the 20th National Congress of the Chinese Communist Party (CCP). It was widely expected that Xi Jinping would be reappointed as the CCP General Secretary for a third time. However, the Politburo Standing Committee was stacked with six other Xi loyalists. This cements his rule over the country and was not viewed positively by the markets.
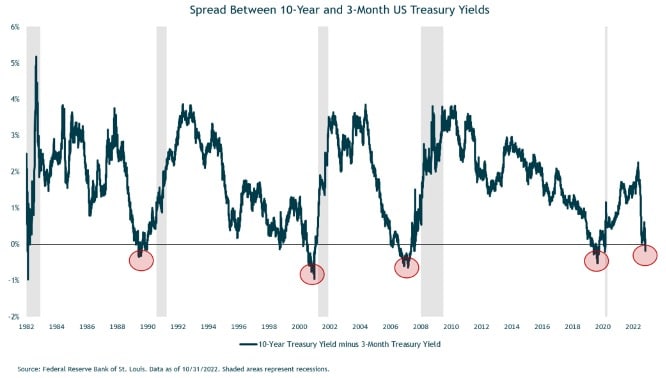
Markets were expecting a fourth straight increase of 75 basis points in the Fed Funds rate at the November 2nd FOMC meeting, and the Fed delivered on this—bringing their target level to 3.75%-4.0%. The often-cited 10-year minus 2-year Treasury yield spread (typically a harbinger of a recession) has been inverted since the summer. However, an even more accurate historical recession predictor is the 10-year minus 3-month spread. This spread had remained positive this year, but on October 31st, the 3-month Treasury yielded 4.22%, exceeding the 10-year Treasury rate of 4.10%. As shown in the chart below, these two yields have reliably inverted prior to past recessions, with a brief exception in 1998.


Higher rates in the US resulted in a negative return of 1.3% for the Bloomberg US Aggregate Bond index. Corporate spreads narrowed during the month, which helped corporates outperform the core bond index. The ICE BofA US Corporate index fell 1.1%, while the ICE BofA US High Yield index fared well with a gain of 2.8%.

