
MAY MARKET UPDATE
THE MONTH AT-A-GLANCE
- Equity markets exhibited volatility during April—as the S&P 500 lost ground for the first time since last October.
- Stubborn inflation and a lower than projected GDP print resulted in some pundits raising the possibility of “stagflation.”
- Both stocks and bonds declined in the month, as hotter inflation drove up bond yields.
MARKET RECAP
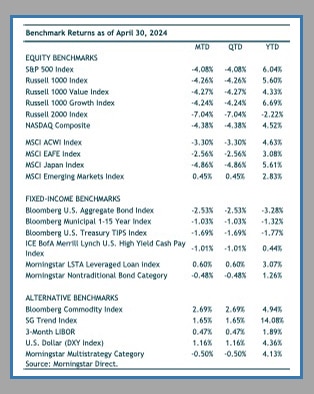
Global stock markets fell for the first time since October 2023. After a strong five-month rally of nearly 24% for MSCI ACWI (November 2023 through March 2024), global stocks fell 3.3% in April. U.S. equities underperformed foreign markets despite a stronger U.S dollar in the month. The S&P 500 fell 4.1%—while MSCI EAFE lost 2.6% and MSCI Emerging Markets eked out a 0.4% gain.
Market weakness in April can be attributed to inflation data that was higher-than-expected, which decreased the number of expected rate cuts this year and moved interest rates higher. Stubborn inflation above the Fed’s target of 2% remains a main risk for markets.

From a sector standpoint, it was the typical risk-off leadership within the S&P 500. Most sectors posted losses—with the utilities sector logging the lone gain (up 1.6%). The real estate sector was the laggard (down 8.5%), as the 10-year U.S. Treasury rate broke through 4.5% and got as high as 4.7%. Of interest was the energy sector’s outperformance in April. Energy stocks fell just 0.8%—exhibiting a more defensive behavior not typically seen. And what’s interesting is that Ned Davis Research noted that energy stocks have consistently outperformed during the last 12 market declines of 5% or more. Since 2021, they say the sector has taken on a more defensive role as inflation has become the primary concern for investors.
Foreign equity markets fared better than U.S. stocks despite a strong dollar. Within developed international markets, European stocks (MSCI Europe) outperformed with a loss of 1.9%. Japanese stocks underperformed due to a weaker yen. MSCI Japan fell 4.9% in April. Emerging-markets stocks outpaced developed market equities last month due to Chinese markets. The MSCI Emerging-Markets Index posted a small gain of 0.4% with Chinese equities (MSCI China) gaining 6.6%.
The Bloomberg U.S. Aggregate Bond Index fell 2.5% in April—it’s worst month since last September. A lack of progress on inflation drove rates higher with the more policy-sensitive two-year rate jumping back over 5%. The yield on the U.S. 10-year Treasury ended the month at 4.69%, nearly half a percentage point higher over the month. Broadly speaking, within fixed income markets, duration underperformed and credit outperformed. The ICE U.S. Treasury 20+ Year Bond Index lost 6.4% of its value in April. Long-dated Treasuries remain in a significant drawdown—down nearly 40% since December 2021.
NOTABLE EVENTS
March’s consumer price index reading came in above consensus and the “last mile” of the fight against inflation is proving harder than some might have expected. Inflation has clearly eased from 2022, however, prices continue to increase at a faster pace than prior to the pandemic. March’s CPI reading was 3.5% (versus 3.4% consensus) and core CPI was 3.8% from a year earlier (versus 3.7% consensus). Despite CPI inflation with a three-handle and increasing shorter-term measures of inflation, Chair Powell pushed back against questions about the potential for rate hikes at his recent May 1st press conference.

At the start of 2023, the market was expecting between 6-7 rate cuts in 2024. At the end of April, the expectation is down to just over one cut. With only one rate cut expected, one can assume that the market is no longer putting a meaningful probability of a recession in the short term.
The narrative of “higher for longer” is now the consensus outlook. The current pause from the Fed has already exceeded the average length of time between the last hike and first rate cut. Data from Morgan Stanley shows that, on average, there is 8.4 months between the last hike and first cut since 1968. The longest periods of “higher for longer” were 1.5 years. The Fed’s last hike in the current cycle was in late-July 2023—making the current pause just over nine months. If the Fed can hold off on cutting rates until the January 2025 meeting, they would match the record of length for a rate pause.
From the Archives:
- May 2021 Market Update
- Q2 2021 Market Recap
- September 2021 Market Update
- October 2021 Market Update
- November 2021 Market Update
- December 2021 Market Update
- Q4 2021 Market Recap
- February 2022 Market Update
- Q1 2022 Market Recap

For discretionary use by investment professionals. Portions of this document are provided by iM Global Partner Fund Management, LLC (“iMGPFM”) for informational purposes only and no statement is to be construed as a solicitation or offer to buy or sell a security, or the rendering of personalized investment advice. There is no agreement or understanding that iMGPFM will provide individual advice to any investor or advisory client in receipt of this document. Certain information constitutes “forward-looking statements” and due to various risks and uncertainties actual events or results may differ from those projected. Some information contained in this report may be derived from sources that we believe to be reliable; however, we do not guarantee the accuracy or timeliness of such information. Investing involves risk, including the potential loss of principal. Any reference to a market index is included for illustrative purposes only, as an index is not a security in which an investment can be made. Indexes are unmanaged vehicles that do not account for the deduction of fees and expenses generally associated with investable products. A list of all recommendations made by iMGPFM within the immediately preceding one year is available upon request at no charge. For additional information about iMGPFM, please consult the Firm’s Form ADV disclosure documents, the most recent versions of which are available on the SEC’s Investment Adviser Public Disclosure website (adviserinfo.sec.gov) and may otherwise be made available upon written request.
Certain material in this work is proprietary to and copyrighted by iM Global Partner Fund Management, LLC and is used by OJM Group with permission. Reproduction or distribution of this material is prohibited and all rights are reserved.
Estimated Returns Disclosure
Scenario Definitions:
Downside: The economy falls into a deep recession for any of various reasons, such as deleveraging/deflation, unexpected systemic shock, geopolitical conflict, Fed or fiscal policy error, etc. At the end of our five-year tactical horizon, S&P 500 earnings are below their normalized trend and valuation multiples are below-average reflecting investor risk aversion. Inflation, 10-year Treasury nominal and real yields are below the Fed’s long-term targets.
Certain material in this work is proprietary to and copyrighted by Litman Gregory Analytics and is used by OJM Group with permission. Reproduction or distribution of this material is prohibited and all rights are reserved.