
FEBRUARY 2022 MARKET UPDATE
The Month At-A-Glance
- Volatility picked up in January resulting in negative returns for both equities and fixed income.
- Fed Chair Jerome Powell has become increasingly hawkish over the last two months as inflation has continued to run at 40-year highs.
- With a rate lift-off all but guaranteed in March, investors are grappling with how quickly the Fed might raise rates in the coming quarters, as well as when it will begin its balance sheet run off (quantitative tightening).
- The highly transmissible Omicron variant sent COVID-19 cases soaring to a record high—however, investors largely looked through this and instead fretted about the rate environment.
Market Recap
U.S. equity markets started off the year in the red. The S&P 500 lost 5.2%, while the Russell 2000 Index fell 9.6% in January. Both were the worst start to a year since 2009. Markets jumped higher over the last few trading days of the month; however, it was not nearly enough to pull markets into positive territory. At one point in the January, the S&P 500 was down almost 10% from its recent all-time high. Small-caps and technology stocks have fared worse in the recent bout of volatility—with the Russell 2000 and NASDAQ Composite falling 20.7% and 16.8%, respectively, since their highs last November. The hardest hit segment of the market has been small-cap growth stocks, which have fallen nearly 30% since last February.
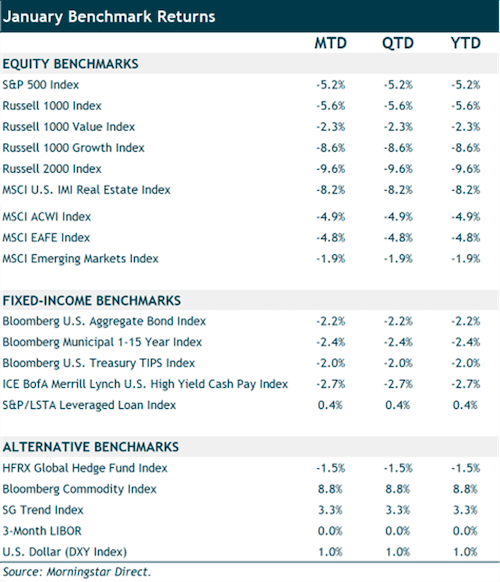
International equity markets fared better than domestic markets despite the U.S. dollar strengthening nearly 1% in January. Developed international stocks fell 4.8% and emerging-markets stocks lost 1.9% last month. We highlighted U.S. dollar strength as typically being a headwind for foreign stock returns in our year-end commentary. While this has certainly been the case over the past year, foreign stocks bucked this trend in January and outpaced U.S. markets despite the stronger dollar.
The bond market also started the year off on rocky footing. Investors pushed rates higher as the Fed continued to signal the end of easy money policies and rate hikes in coming months. Rates moved sharply higher on the short-end of the Treasury curve—rising approximately 40 basis points in the one-to-five-year part of the curve. The heavily watched 10-year Treasury yield went from 1.52% to 1.79% during January. As a result, the core bond index fell 2.2% in January—its worst start to a year since 1980. High-yield bonds fared slightly worse with a loss of 2.7%. Floating-rate loans outperformed with a modest gain of 0.4%.
Notable Events
The wheels are in motion for the Fed to begin tightening monetary policy at their next policy meeting, and investors are watching nervously. The Fed has pivoted relatively sharply in recent months—moving from being patient on inflation to a stance that’s much more aggressive. The current plan is to stop asset purchases by early March, raise the Fed funds rate in mid-March, and start quantitative tightening (reducing their balance sheet) soon after.
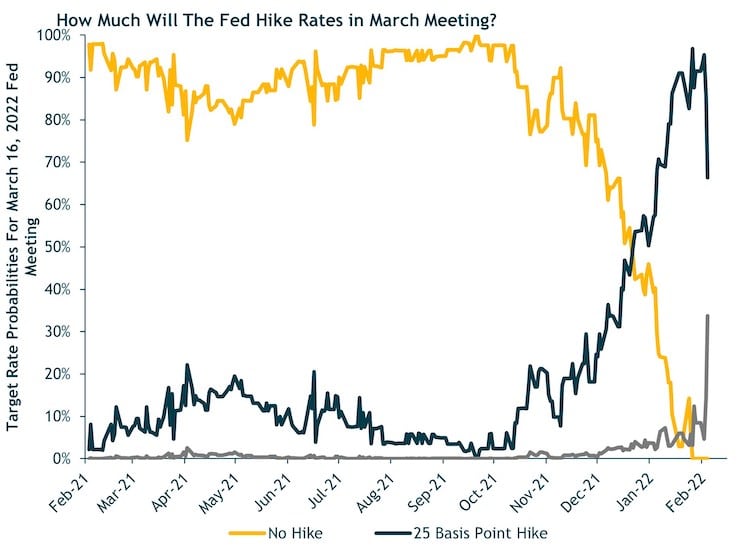
With headline inflation running at a 40-year high and the labor market on solid footing (recall the Fed’s mandate of stable prices and maximum employment), it is hard to argue that the current easy monetary policy is warranted. The bond market no longer thinks so—and has been increasingly betting on numerous rate hikes this year. As shown in the chart above, since last November, the market has been upping the odds that the Fed would increase rates at their March policy meeting. By January, it reached near certainty that the Fed would hike. And it is interesting to note that in recent days there has been a significant jump in the probability of the Fed raising rates by 50 basis points. Though it’s not the likely outcome at this point, the market has ascribed as high as a 33% chance of a 50 basis point hike in March. It wasn’t long ago that the Fed was signaling to the market that they didn’t expect to raise the Fed Funds rate until 2024. However, the inflation data has continued to come in well above target and the labor market has tightened with wages rising—leading to the Fed pivoting sharply.
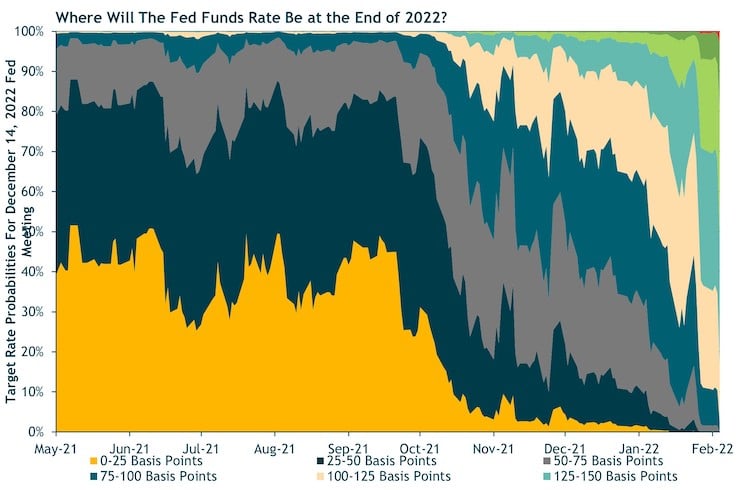
With lift-off all but certain for March, investors are betting on multiple rate hikes in 2022. Current data shows the market giving the highest probability to a Fed Funds rate at 1.25%-1.5% in December. This equates to five hikes in 25 basis point increments. This would be a significantly faster pace than the last hiking cycle (2015 to 2018). It took two years—December 2015 to December 2017—for the Fed Funds rate to get to 1.25%-1.5%. The market is wagering that the Fed may get there in just nine months this time around. Of course, inflation is the key variable that is vastly different today than it was seven years ago (both core PCE—the Fed’s preferred inflation measure—and headline CPI averaged sub-2% back then). With core PCE at nearly 5% and CPI over 7% today, a faster hiking cadence appears to be in the cards. But as always, the Fed says it will remain “data dependent,” and there is no guarantee the current market (or Fed) rate expectations will play out.
Investment Takeaways
In a period of rising interest rates, we would expect our active bond managers, in aggregate, to outperform the Bloomberg U.S. Aggregate Bond Index. During the last hiking cycle (first hike in late-2015 to last hike in late-2018), the core bond index returned just shy of 2% annualized. While returns were positive for core bonds, it is worth noting that the yield environment was different back then from what it is today. Investment-grade corporate bond spreads were closer to 200 basis points around the time of the first hike (with a yield of 3.7%) and spreads fell to 100 basis points by early 2018 (before widening throughout 2018). Today, high-quality corporate spreads are already sub-100 basis points—just about their all-time lows—and inching upward, with the investment-grade corporate index yielding a mere 2.8%. Positive gains from yield pickup and spread compression will be harder to come by this time around.
Despite the relatively less attractive yield environment investors face in this hiking cycle, we would still expect our active bond managers to outperform the Bloomberg U.S. Aggregate Bond Index given the majority have significantly less duration than the core bond index. The effective duration (or interest-rate sensitivity) for the Aggregate index is close to 6.75 years today, whereas our active core bond exposure, in aggregate, has slightly shorter rate risk than the benchmark. We maintain our underweight to core bonds in favor of flexible bond managers that have significantly lower duration and higher yields than the benchmark. Assuming credit spreads don’t widen significantly as rates rise, we would expect our active bond funds to perform well relative to the core bond index over the course of the year.