
DIVING INTO NOVEMBER'S MARKET PERFORMANCE
THE MONTH AT-A-GLANCE
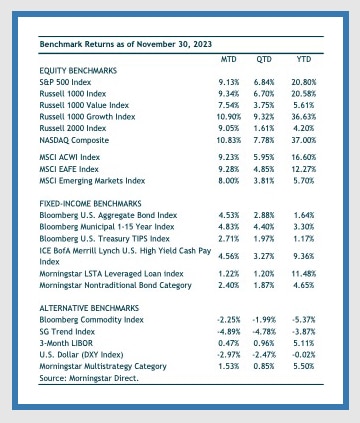
- The S&P 500 snapped its three-month losing streak with a return of 9.1%
- Foreign equity markets joined the rally with a similar 9% gain
- The bond market had its best month since the 1980s—as the Bloomberg U.S. Aggregate Index rose 4.5%
- Interest rates moved higher in the month with the 10-year US Treasury briefing touching 5%
MARKET RECAP
It was a November to remember. It was an “everything” rally during the month. Record gains in November were on the back of three straight months of losses for the stock market and six consecutive months of losses for bonds. The 9.1% gain of the S&P 500 was its 7th best monthly return this century. The Bloomberg U.S. Aggregate Bond Index rose 4.5%, which was its best monthly gain this century and its best month since the mid-1980s.
Developed international stocks (MSCI EAFE) narrowly outperformed the S&P 500. MSCI EAFE gained 9.3% in November, while emerging-markets stocks gained a solid 8%. A weaker dollar helped dollar-based investors in foreign markets meaningfully. The U.S. dollar index declined nearly 3% in November—adding at least that amount to returns when converted from local markets to dollar terms. For example, MSCI EAFE gained 5.6% in local currency terms, but netted a solid 9.3% in dollar terms.
As the narrative around peak rates was reinforced throughout the month, growth stocks added to their enormous year-to-date lead over value stocks. The Russell 1000 Value Index posted a more than respectable gain of 7.5% but was not a match for its growth counterparts’ return of 10.9%. So far this year, large cap growth stocks are outperforming large cap value stocks by a colossal 31 percentage points! 2023 has been the second-best year for growth stocks relative to value stocks since the first full calendar year of the Russell 1000 style indexes in 1979.


NOTABLE EVENTS
Softening inflation data and a cooling labor market was looked upon constructively by the markets. Both reinforced the view that central banks have finished their swift tightening cycles. And even though central bankers may not want to cut rates in the near future, investors are anticipating that peak rates have been reached.
On the inflation front, core PCE (the Fed’s preferred inflation measure) continues to come down. The recently released figure for October was 3.5% year-over-year. This is down from a peak of 5.6% in February 2022. A more real-time measure of core PCE—the annualized six-month figure—is running at 2.5%, which is closing in on the Fed’s 2% long-term target. Should inflation continue to fall without a meaningful uptick in the unemployment rate or slowdown in the economy, the Fed may pull off the “soft landing” scenario that seemed so low probability a year ago. For now, the macro conditions are benign, however, the impact of 550 basis points of rate hikes in the span of 16 months could still rear its head.
While the labor market remains on solid footing, there are signs it is cooling. A softer jobs market has generally been viewed as positive by the market as it lowers the potential for additional rate hikes by the Fed. A sharp acceleration upwards in the unemployment rate would certainly be looked upon negatively by investors, however, for now, a cooling jobs market is encouraging. One data point showing signs of increasing weakness in the labor market is that continuing jobless claims (a measure of how many people are receiving unemployment benefits) has risen to a two-year high. For the week ending November 18, continuing claims hit 1.93 million (see chart below). The measure has been moving higher since September—indicating increasing difficulty for those who are unemployed to find a new position.

