
FEBRUARY'S PERFORMANCE COMES ON THE HEELS OF A RECORD-BREAKING JANUARY
THE MONTH AT-A-GLANCE
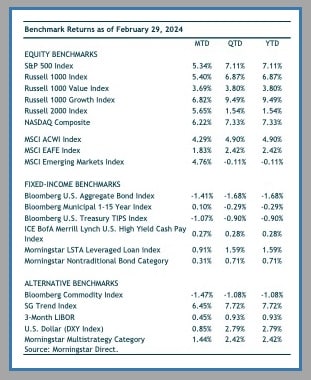
- After surpassing its all-time high in January, the S&P 500 powered through the 5,000 level to finish the month 5.3% higher.
- Momentum within growth stocks continued with Russell 1000 Growth adding 6.8% in February, which brings its trailing one-year return to nearly 46%!
- Resilient economic data and stickier inflation readings pushed back on market expectations for rate cuts in 2024.
- The longer end of the U.S. Treasury yield curve moved higher during month resulting in a 1.4% loss for the Bloomberg U.S. Aggregate Bond Index.
MARKET RECAP
Global equity markets notched another solid month. U.S. large-cap growth stocks led the way (yet again). The Russell 1000 Growth Index’s year-to-date return is already just shy of 10%—trouncing value stocks for another month. NVIDIA continues to be the hot stock that investors are betting will be the winner of the AI revolution. NVIDIA’s stock price increased more than 28% in February and has now gained 241% over the last 12 months. However, to be fair, it’s not all speculation. Relentless demand for NVIDIA’s AI chips helped the company report fiscal year revenue growth of 265% and an increase in net income of 585% in their recent earnings release. NVIDIA is clearly benefiting from the unquenchable demand for their products as AI has hit a tipping point.

Enthusiasm about the prospects for AI has propelled growth stocks higher as investors expect many of these companies to continue to operate with the wind at their backs. The decade of the 2010s also saw growth stocks beat value stocks, however, it was a prolonged “death by a thousand cuts.” The outperformance of growth stocks so far in the 2020s has been marked by violent swings in both directions. Value stocks have underperformed by greater than 30% on two occasions over a trailing 12-month period, as well as outperformed growth stocks by well over 20% during 2022.

Foreign equity markets joined the rally in February. Emerging-markets stocks outpaced developed international thanks to a bounce in Chinese markets. The MSCI Emerging-Markets Index returned 4.8% with Chinese equities (MSCI China) gaining 8.4%. U.S. dollar strength pared gains for developed international stocks. MSCI EAFE logged a 3% return in local currency terms but when converted to U.S. dollars, gained 1.8%. Japanese equities remain among the top-performing equity markets this year. The Nikkei 225 Index reached a new all-time high that had been in place since the late 1980s! Japanese equities continued to move higher despite a weaker-than-expected fourth quarter GDP figure that put Japan’s economy into a technical recession (two consecutive negative GDP).

The Bloomberg U.S. Aggregate Bond Index fell 1.4% in February as longer-term rates moved higher amid the repricing of the timing and the likelihood of fewer rate cuts this year. The yield on the U.S. 10-year Treasury closed February at 4.25%, roughly 25 basis points higher from the end of the previous month. The yield curve (chart below) remains inverted, though less so than it was in the second quarter of last year. An inverted yield curve has historically been an indicator of a looming recession. However, the record amount of time the yield curve has been inverted during this cycle has called into question its usefulness as a timing tool. A closer look at the three-month/10-year yield spread would show recessions typically happen after the yield curve un-inverts. While a recession call is not our near-term scenario, we believe the longer the Federal Reserve holds short-term rates at higher levels, the more likely the economy could falter. The Fed has historically been too slow to commence both hiking and cutting cycles.

NOTABLE EVENTS
Market expectations for rate cuts continue to be priced out of the market as Fed officials continue to reiterate their desire to gain greater confidence that inflation is moving towards their 2% target. Upside surprises in consumer and production prices in the January readouts did not help those betting on sooner rather than later rate cuts. As many as six rate cuts were priced in at the start of year, but now the expectation is closer to three cuts (which is in-line with the Fed’s December projection).
Above consensus figures on CPI (consumer price index) and PPI (producer price index) reinforces the Fed’s wait-and-see approach to inflation. Core CPI for January registered at 3.9% compared to a consensus estimate of 3.7%. PPI notched a monthly gain of 0.3% (versus 0.1% forecast) and increased 0.9% year-over-year (versus 0.6% forecast). The Fed’s preferred inflation measure, core PCE, was released in late February and seemed to alleviate some fears over the hotter-than-expected CPI and PPI numbers. Core PCE came in at 2.8%—still above the Fed’s target—which was right in line with market expectations. However, core PCE’s 0.4% month-over-month increase was the highest reading in the last 12 months.

Note: For discretionary use by investment professionals. This document is provided by iM Global Partner Fund Management, LLC (“iMGPFM”) for informational purposes only and no statement is to be construed as a solicitation or offer to buy or sell a security, or the rendering of personalized investment advice. There is no agreement or understanding that iMGPFM will provide individual advice to any investor or advisory client in receipt of this document. Certain information constitutes “forward-looking statements” and due to various risks and uncertainties actual events or results may differ from those projected. Some information contained in this report may be derived from sources that we believe to be reliable; however, we do not guarantee the accuracy or timeliness of such information. Investing involves risk, including the potential loss of principal. Any reference to a market index is included for illustrative purposes only, as an index is not a security in which an investment can be made. Indexes are unmanaged vehicles that do not account for the deduction of fees and expenses generally associated with investable products. A list of all recommendations made by iMGPFM within the immediately preceding one year is available upon request at no charge. For additional information about iMGPFM, please consult the Firm’s Form ADV disclosure documents, the most recent versions of which are available on the SEC’s Investment Adviser Public Disclosure website (adviserinfo.sec.gov) and may otherwise be made available upon written request.
Estimated Returns Disclosure
Scenario Definitions:
Downside: The economy falls into a deep recession for any of various reasons, such as deleveraging/deflation, unexpected systemic shock, geopolitical conflict, Fed or fiscal policy error, etc. At the end of our five-year tactical horizon, S&P 500 earnings are below their normalized trend and valuation multiples are below-average reflecting investor risk aversion. Inflation, 10-year Treasury nominal and real yields are below the Fed’s long-term targets.
Certain material in this work is proprietary to and copyrighted by Litman Gregory Analytics and is used by OJM Group with permission. Reproduction or distribution of this material is prohibited and all rights are reserved.