MAY 2025 MARKET COMMENTARY
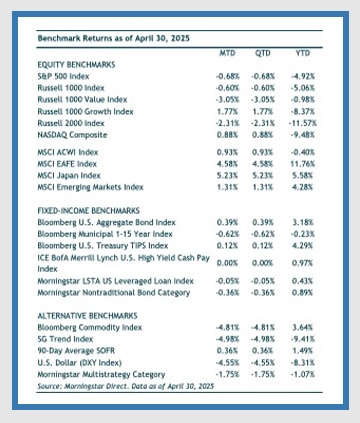
For the month of April, the S&P 500 ended down just under 1%, masking wild intra-month market volatility. President Trump’s April 2nd “Liberation Day” announcement of sweeping and unexpectedly high tariffs caught investors off guard and stocks suffered two consecutive daily losses of 4.8% and 6.0% on April 3rd and 4th, respectively, making it one of the worst two-day drawdowns in history. However,
as the month progressed, a combination of strong corporate earnings and a 90-day pause in some of the announced tariffs helped stabilize the market. By the end of April, the S&P 500 had recovered much of its earlier losses.
Overseas equity markets also faced meaningful volatility but ended April with positive returns. Developed International stocks (MSCI EAFE Index) gained 4.6%, while emerging markets (MSCI EM Index) were up 1.3%. Nearly all the relative outperformance of international equities versus U.S. stocks was due to the 4.6% downward slide in the U.S. dollar (DXY Index).

Within fixed-income, bond yields followed a similar pattern of volatility but ended the month with yields moving slightly lower, with the 10-year U.S. Treasury yield falling from 4.23% to 4.17%. In this environment, core investment-grade bonds (Bloomberg US Aggregate Bond) gained 0.4%, while high-yield bonds (ICE BofA Merrill Lynch High Yield Index) were flat in during the month.
MARKET RECAP
Although the market has once again demonstrated resilience, our expectation has been, and remains, that the economy is slowing. Now the big question is whether a recession is on the horizon. And if so, will it be mild or protracted? In our view, the answer will depend on the timing of policy, both from the White House regarding tariffs and the Fed regarding interest rates. The longer the uncertainty around tariffs lingers, the higher the odds of a recession.
As for the Fed, inflation has been steadily declining, but a tariff-driven inflationary spike is expected to emerge later this spring and summer. We think it’s likely that the Fed will look through temporary inflation shocks due to tariffs and focus on the health of the labor market.
Within the labor market, we think hiring will be the key metric to monitor. Many market participants, including us, continue to watch weekly jobless claims and nonfarm payrolls for signs of labor market deterioration, although we believe these indicators may generate less of a signal in this cycle. Instead, we are paying close attention to hiring rates, not layoffs, which we think could be the more reliable leading indicator. In a healthy labor market, laid-off workers quickly find new opportunities. But as hiring slows, re-entry into the labor force becomes more difficult, gradually pushing up the unemployment rate.
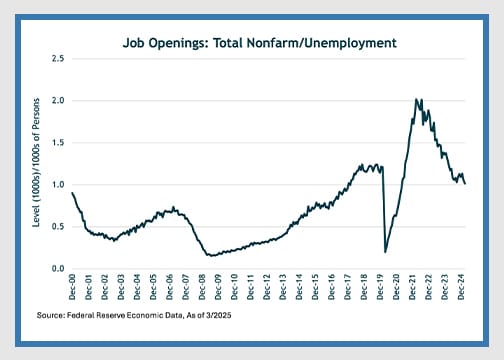
Looking at some current data, current job openings-to-unemployed ratio is 1x (see chart below), down from a peak of over 2x post-COVID but above the pre-pandemic average of 0.5x. The number of people unemployed for less than five weeks is increasing since 2023, while the number unemployed for more than 27 weeks is up more meaningfully. We think these trends indicate a softening labor market characterized not by mass layoffs, but by reduced hiring and fewer new job opportunities.
Looking ahead, fiscal policy may play a more important role in shaping the labor market’s trajectory. President Trump has proposed some expansionary tax reforms, including expanding and extending the 2017 Tax Cuts and Jobs Act, eliminating income taxes on tips, overtime, and Social Security benefits, reducing corporate tax rates, and creating new deductions, such as for auto loan interest. While still subject to political negotiation, these proposals represent a material increase in the fiscal impulse, potentially widening the base of labor market support.
Another critical factor is labor market size. Following the pandemic, the U.S. saw a significant immigration-driven increase in the prime-age labor force. This expanded labor pool helped soften wage pressures even as the economy recovered in 2023 and early 2024. However, with today’s more restrictive immigration policies, the workforce size could start to shrink. This means that even if fewer jobs are being created, the unemployment rate might stay steady or fall because there would be fewer people looking for work in the first place.

As for the timing of rates cuts, we believe the Fed will likely wait until summer to offer more concrete guidance. By that time, a slowing labor market will likely coincide with the tariff-driven inflation bump, putting the Fed in a position where it must prioritize one of its mandates over the other, i.e., full employment vs persistently low inflationary. We suspect they will prioritize the health of the labor market. We will have to see how the data evolves but we would not rule the Fed moving swiftly if need be. We continue to monitor these evolving data and will adjust positioning as needed to navigate this complex and shifting landscape.
U.S. DOLLAR
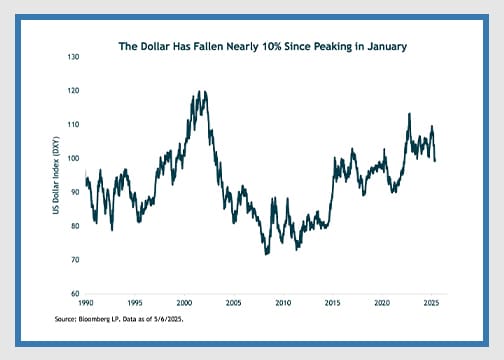
Despite the heighted volatility following the announcement of punitive Liberation Day tariffs, equity indexes recovered much of their losses. The U.S. dollar, however, did not recover its losses and continues to tumble. The dollar (DXY Index) fell 4.6% in April—bringing its year-to-date loss to over 8%. This has been a nice tailwind for unhedged non-dollar assets. For example, European equities (MSCI Europe) had similar returns as U.S. stocks in local currency terms, losses of 0.6% and 0.7%, respectively. However, the weakening dollar resulted in MSCI Europe increasing 4.6% in dollar terms (the common performance measurement of U.S.-based investors).
Over the years we’ve pointed to the U.S. dollar as a key driver behind the outperformance of U.S. equities versus international equities. This has certainly been the case so far in 2025, when a weakening dollar has helped international equities meaningfully outpace U.S. stocks this year.
The announcement of tariffs was widely expected to send the U.S. dollar higher. As is commonplace in markets, consensus was proven wrong, and the dollar has sunk. Tariffs ended up being surprising significantly to the upside and yet the dollar tumbled.
Interestingly, the current Administration would like to see a weaker dollar (while maintaining its reserve currency status). At the heart of their policies is an attempt to reconfigure the global trading systems by weakening the U.S. dollar (making exports more competitive), closing trade deficits, and increase the U.S. share of manufacturing jobs.

The chronic overvaluation of the U.S. dollar is central to many of the issues the Administration wants to address. Stephen Miran (current Chair of the Council of Economic Advisors) argues that the dollar strength “makes U.S. exports less competitive, U.S. imports cheaper, and handicaps American manufacturing.”
“America First” policies have likely lessened the appeal for the dollar. A more isolated economy decreases global trade and marginally reduces the need to hold dollars. It increases the risk premium of holding dollar assets, which is something that has been close to nil over the past decade plus. Foreign investors have recycled their dollars into U.S. stocks and bonds, resulting in record high holdings of U.S. assets. When the marginal investor no longer gets invested into U.S. assets, it has the potential to tip the trend that has been in place for 15 years.
From the Archives: A Strengthening Dollar Impacts Equities and Fixed Income Markets
DISCLOSURE:
For discretionary use by investment professionals. Portions of this document are provided by iM Global Partner Fund Management, LLC (“iMGPFM”) for informational purposes only and no statement is to be construed as a solicitation or offer to buy or sell a security, or the rendering of personalized investment advice. There is no agreement or understanding that iMGPFM will provide individual advice to any investor or advisory client in receipt of this document. Certain information constitutes “forward-looking statements” and due to various risks and uncertainties actual events or results may differ from those projected. Some information contained in this report may be derived from sources that we believe to be reliable; however, we do not guarantee the accuracy or timeliness of such information. Investing involves risk, including the potential loss of principal. Any reference to a market index is included for illustrative purposes only, as an index is not a security in which an investment can be made. Indexes are unmanaged vehicles that do not account for the deduction of fees and expenses generally associated with investable products. A list of all recommendations made by iMGPFM within the immediately preceding one year is available upon request at no charge. For additional information about iMGPFM, please consult the Firm’s Form ADV disclosure documents, the most recent versions of which are available on the SEC’s Investment Adviser Public Disclosure website (adviserinfo.sec.gov) and may otherwise be made available upon written request.
Certain material in this work is proprietary to and copyrighted by iM Global Partner Fund Management, LLC and is used by OJM Group with permission. Reproduction or distribution of this material is prohibited and all rights are reserved.
For informational purposes only. OJM Group, LLC is an investment adviser registered under the Investment Advisers Act of 1940. Registration as an investment adviser does not imply any level of skill or training. For more information about OJM Group please visit https://adviserinfo.sec.gov/ or contact us at 877-656-4362. Not intended as legal or investment advice or a recommendation of any particular security or strategy. Information prepared from third-party sources is believed to be reliable though its accuracy is not guaranteed. Investing involves risk and possible loss of principal capital. Past performance is not indicative of future results.
Index Disclosure: An index is an unmanaged portfolio of specific securities, the performance of which is often used as a benchmark in judging the relative performance of certain asset classes. Investors cannot invest directly in an index. An index does not charge management fees or brokerage expenses, and no such fees or expenses were deducted from the performance shown. Index returns shown are price returns, which exclude dividends and other earnings.


