DECODING THE 2ND QUARTER OF 2025
MARKET RECAP
In the second quarter of 2025, global markets faced a complex mix of encouraging economic data, ongoing geopolitical uncertainty, and evolving global central bank policies. Nonetheless, the S&P posted a strong gain, reaching a new all-time high, and fixed-income markets were positive across most segments.
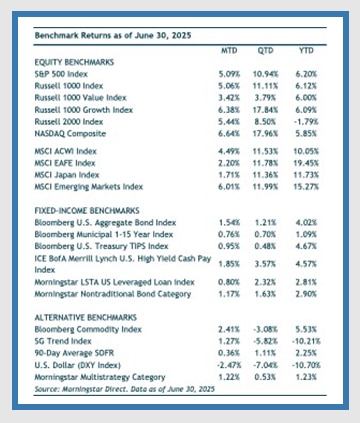
The S&P 500 gained 10.94% in the second quarter, driven by continued earnings resilience in the technology and communication services sectors. Year to date, the index is up 6.2%. The Nasdaq posted a stronger 17.96% return for the quarter, lifted by optimism around AI-driven productivity and corporate investment in cloud infrastructure. Small-cap stocks also moved higher in the three-month period, gaining 8.5% (Russell 2000).
Internationally, developed market performance was also strong gaining 11.78% (MSCI EAFE). Importantly, most of this return is due to currency effects, specifically a weaker U.S. dollar. (In local currency, returns were 4.8%.)

Emerging markets rose 11.99% (MSCI EM) benefiting from improving sentiment around China’s fiscal stimulus and currency stabilization efforts. Geopolitical risks, including ongoing instability in Eastern Europe and the Middle East, remain potential catalysts for volatility.
Within fixed-income, our expectation has been that rates will remain volatile and range bound, which played out in the second quarter. The 10-year Treasury yield started the quarter at 4.23% and ranged between 4.01% and 4.58% before ending the quarter at 4.24%. In the period, investment-grade core bonds ended the quarter up 1.21% (Bloomberg US Aggregate Bond). Lower quality high-yield bonds were up 3.57% (ICE BofA US High Yield) as investors’ appetite for risk increased.
EQUITIES
The second quarter started out with significant volatility with the tariff announcement on April 2nd. The punitive tariffs were meaningfully higher than investors had been expecting. This negative surprise sent equity markets sharply lower. The S&P 500 fell 4.8% and 6% on April 3rd and 4th, respectively. The sell-off continued until April 9th when President Trump announced a 90-day pause on all tariffs, (set to expire on July 9). Following the pause, the S&P 500 rallied 9.5% in a single day and continued to rally over 25%, recovering all the losses since the market peaked in February.
By the end of the quarter, the S&P 500 had reached its all-time high at 6,204, bringing its year-to-date return to 6.20% through June.
While most assets have seen their values recover, that hasn’t been the case for the U.S. dollar. The dollar continued to weaken throughout the quarter and has fallen over 10% on the year. The U.S. Dollar Index has fallen to levels last seen over three years ago. We have long written about the dollar and its importance to foreign equity returns relative to U.S. equities. Should the dollar continue to trend lower, this would continue to be a tailwind for foreign equity returns relative to domestic returns.
So far, the uncertainty and angst surrounding the tariffs has mainly impacted market sentiment and not fundamentals. First quarter earnings wrapped up with a strong showing, growing over 13% compared to a consensus forecast of mid-single digit growth at the start of earnings season. The bigger test will be over the next two quarters, which will start to incorporate the impacts from tariff.
FIXED INCOME
U.S. Treasury yields moved modestly lower across most of the yield curve during the quarter, reflecting growing expectations that the Federal Reserve is approaching an inflection point in its policy stance. The 10-year yield declined approximately 20 basis points over the quarter, ending near 4.20%, while the 2-year yield fell slightly more, reflecting anticipation of rate cuts by year-end. The curve was slightly inverted at the end of June, a signal of shifting market sentiment toward a softer economic trajectory.
While interest rates were volatile for most of the year with swift and meaningful moves, rate volatility has subsided a bit late in the second quarter. For example, the MOVE Index (a proxy for Treasury market volatility) declined meaningfully as economic data began to show more consistent signs of slowing inflation and moderate growth. The more stable macro backdrop contributed to a less reactive interest-rate market, even as Fed communications remained cautious.
Investment-grade and high-yield corporate bonds posted gains in the quarter, and spreads remained broadly resilient. Investment-grade spreads tightened modestly, supported by solid corporate fundamentals, low default activity, and ongoing demand for high-quality yield. High-yield spreads experienced some mild widening mid-quarter amid pockets of risk aversion but tightened by quarter-end, finishing largely unchanged. Overall, credit markets reflected a “soft landing” consensus, though with increasing focus on idiosyncratic risk and corporate refinancing needs heading into 2026.
CLOSING THOUGHTS
The second quarter’s equity rebound reflects growing investor optimism that a soft landing remains likely, with inflation easing and central banks, particularly the Fed, gaining room to cut rates. In the U.S., equity performance continues to be led by a narrow set of large-cap growth/technology stocks, though market breadth has improved modestly from last year.
Outside the U.S., valuation discounts for international stocks remain meaningful relative to the U.S., but currency dynamics and geopolitical uncertainty continue to present near-term risks. We see potential for select international exposures to outperform, particularly if the dollar continues to weaken alongside Fed policy shifts.
As we enter the second half of 2025, our outlook remains constructive but cautious. We believe markets will continue to be shaped by a tug of war between slowing economic growth and the prospect of rate relief alongside further resolution to the tariff situation and the upcoming legislation. We continue to think economic growth will slow but not collapse. Themes to watch in the remainder of the year will be Fed policy shifts, corporate earnings strength, and geopolitical risks.
DISCLOSURE:
For discretionary use by investment professionals. Portions of this document are provided by iM Global Partner Fund Management, LLC (“iMGPFM”) for informational purposes only and no statement is to be construed as a solicitation or offer to buy or sell a security, or the rendering of personalized investment advice. There is no agreement or understanding that iMGPFM will provide individual advice to any investor or advisory client in receipt of this document. Certain information constitutes “forward-looking statements” and due to various risks and uncertainties actual events or results may differ from those projected. Some information contained in this report may be derived from sources that we believe to be reliable; however, we do not guarantee the accuracy or timeliness of such information. Investing involves risk, including the potential loss of principal. Any reference to a market index is included for illustrative purposes only, as an index is not a security in which an investment can be made. Indexes are unmanaged vehicles that do not account for the deduction of fees and expenses generally associated with investable products. A list of all recommendations made by iMGPFM within the immediately preceding one year is available upon request at no charge. For additional information about iMGPFM, please consult the Firm’s Form ADV disclosure documents, the most recent versions of which are available on the SEC’s Investment Adviser Public Disclosure website (adviserinfo.sec.gov) and may otherwise be made available upon written request.
Certain material in this work is proprietary to and copyrighted by iM Global Partner Fund Management, LLC and is used by OJM Group with permission. Reproduction or distribution of this material is prohibited and all rights are reserved.
For informational purposes only. OJM Group, LLC is an investment adviser registered under the Investment Advisers Act of 1940. Registration as an investment adviser does not imply any level of skill or training. For more information about OJM Group please visit https://adviserinfo.sec.gov/ or contact us at 877-656-4362. Not intended as legal or investment advice or a recommendation of any particular security or strategy. Information prepared from third-party sources is believed to be reliable though its accuracy is not guaranteed. Investing involves risk and possible loss of principal capital. Past performance is not indicative of future results.
Index Disclosure: An index is an unmanaged portfolio of specific securities, the performance of which is often used as a benchmark in judging the relative performance of certain asset classes. Investors cannot invest directly in an index. An index does not charge management fees or brokerage expenses, and no such fees or expenses were deducted from the performance shown. Index returns shown are price returns, which exclude dividends and other earnings.

