SEPTEMBER 2025 MARKET UPDATE
Throughout August investors were faced with mixed economic data and a steady stream of political headlines. Investors had to weigh softer economic results against still-firm inflation, political headlines over risks to the Federal Reserve’s independence, and the integrity of economic data.
MARKET OVERVIEW
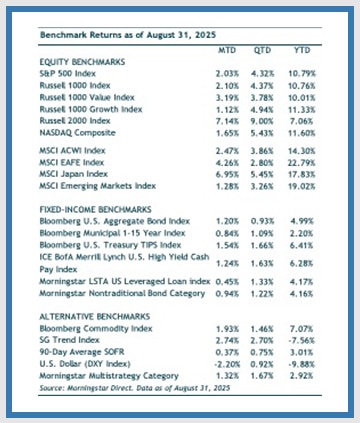
Despite the crosscurrents, U.S. equities pushed higher. The S&P 500 closed August at record levels, advancing 2% for the month, supported by strong corporate earnings and continued enthusiasm for large-cap technology leaders. Small-cap stocks (Russell 2000 Index) gained 7.1%, outperforming large-caps (S&P 500 Index) as renewed optimism around Fed rate cuts boosted this more rate-sensitive segment.
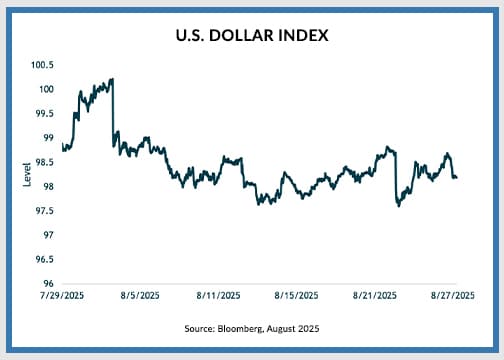
Foreign markets benefited from dollar weakness. Developed international equities (MSCI EAFE Index) rose 4.3 %, while emerging markets (MSCI EM Index) climbed 1.3%. The dollar softened first in August following a weak jobs report, and again after Fed Chair Powell’s dovish remarks at Jackson Hole, both of which reinforced expectations for rate cuts.

In fixed income, the expected rate cuts pushed yields lower across most of the Treasury curve. The 2-year yield fell 0.35% to 3.57%, while the 10-year declined 0.14% to 4.23%. The 30-year Treasury was essentially unchanged at 4.9%. Core bonds (Bloomberg U.S. Aggregate Bond Index) benefited from lower rates and gained 1.2% in August. High-yield bonds (ICE BofA U.S. High Yield Index) performed similarly, gaining 1.2%, reflecting continued investor confidence in the economic outlook. Year-to-date, high yield has outperformed investment-grade bonds.
ECONOMIC ENVIRONMENT
The month started with a sign that the job market is losing momentum. The July jobs report, released August 1st, showed nonfarm payrolls rising just 73,000, which was below expectations. Furthermore, the prior two months were revised lower by more than 250,000. Concurrently, the unemployment rate ticked up from 4.1% to 4.2%, which is still a historically low level. For investors, this data led to a reduction in economic growth expectations and optimism that the Federal Reserve may resume rate cuts after one of the longest pauses in a rate cut regime.
Inflation data complicated the market’s rate-cut narrative. In mid-August, the Consumer Price Index came in largely as expected, with core inflation up 3.1% year-over-year. While not alarming, the figure underscored that price pressures remain meaningfully above the Fed’s 2% target. Only two days later, the Producer Price Index surprised on the upside with its largest monthly increase in three years, reinforcing the thinking that inflation’s path back to target will not be linear and might still be a way off. On the last trading day of the August, the Personal Consumption Expenditures index, the Fed’s preferred inflation gauge, showed year-over-year inflation is running at 2.9%.
Markets also had to digest another source of volatility: politics. President Trump increased his public criticism of the Fed for not lowering interest rates, and late in the month moved to fire a sitting Fed Governor. Legal challenges are expected, but this underscored the political risks surrounding monetary policy. Fed Chair Jerome Powell, speaking at the Jackson Hole conference on August 22nd, struck his usual pragmatic tone, acknowledging softer growth data while keeping optionality on the table. His remarks were interpreted as opening the door to a September rate cut, and markets reacted positively with equities rallying while shorter-term Treasury yields moved lower.
EQUITIES
Corporate earnings offered a steadier backdrop. At the end August, second-quarter reporting was essentially complete, and S&P 500 earnings growth was 11.9%, compared to 4.8% projected at the end of June (according to FactSet data). This was the third straight quarter of double-digit growth. Results were strongest in the technology and communications sectors, where the artificial intelligence theme continues to dominate. At the same time, investors remained highly attuned to single stock catalysts, with much of the sentiment tethered to NVIDIA’s earnings. The result was a market that looks strong at the headline level, but with leadership increasingly narrow and valuations (23x forward earnings), remaining elevated.
Stocks reflected this balance between optimism and caution. The S&P 500 and Nasdaq notched fresh highs, but day-to-day swings were driven by Fed expectations and AI headlines. Beneath the surface, market breadth softened, with a smaller group of mega-cap stocks accounting for the lion’s share of performance. This narrowing of leadership is an important watch point as we enter the historically more volatile September and October stretch.
In August we saw U.S. stocks lag developed foreign equities. The U.S. dollar was a key driver. The chart below shows the DXY Index, a measure of the U.S. dollar relative to a basket of six major world currencies, from July 31 through August 26.

The weaker dollar this year has clearly benefited foreign assets. The question going forward is if the dollar’s trend continues. The current Administration clearly wants lower interest rates. While Trump’s confrontations with the Fed are raising concerns about the Fed’s independence, we have to believe that part of the administration’s motivation is fiscal sustainability, as it has also been vocal about wanting to ease the increasing interest-payment burden of the U.S. Treasury. Interest rate levels relative to other countries have an important impact on the value of U.S. dollar. So, to the extent that U.S. rates are relatively less attractive, it would likely push the dollar lower.
We also consider economic growth, which impacts interest rates. Current immigration policies, according to sources such as the Yale Budget Lab, are projected to lower GDP by approximately 0.5% going forward. Slower growth could necessitate lower rates, and therefore a weaker dollar.
On the flip side, the market is telling us that it is currently constructive on the economy. Not only is the S&P near all-time highs, but yields in the credit market are trading at historical tights (relative to Treasuries). Consumption may be slowing; however, economic growth is being lifted by significant tech sector capital expenditures and continued government spending. Credit markets often detect trouble before the equity market, and it’s common to see spreads rise in advance of a recession. That’s not the case now. One metric we observe is the yield on the lowest-quality bonds compared to Treasuries, which in theory should be one of the earliest warnings signs. Today that metric is tightening and is at levels that suggest optimism.
FINAL WORDS
August reinforced reasons for both optimism and caution. Earnings remain supportive, providing a solid fundamental anchor, but equity valuations are stretched, and leadership remains narrow, leaving markets more vulnerable to shifts in sentiment. In fixed income, bonds continue to present attractive yield opportunities, particularly in non-traditional and diversified segments, offering investors both income and a measure of resilience.
Looking ahead, we continue to expect a slowdown, accompanied by periods of volatility as markets react to shifting labor market data, inflation data, and ongoing communications from the Fed. These challenges are compounded by an unusually politicized policy backdrop (e.g., the legality of the tariffs), which could inject additional uncertainty into monetary and fiscal expectations.
In this environment we are closely monitoring developments and will continue to look for opportunities that balance growth potential with prudent risk management. We remain diversified across geographies and asset classes, and we continue to take advantage of select income opportunities in fixed-income.
DISCLOSURE:
For discretionary use by investment professionals. Portions of this document are provided by iM Global Partner Fund Management, LLC (“iMGPFM”) for informational purposes only and no statement is to be construed as a solicitation or offer to buy or sell a security, or the rendering of personalized investment advice. There is no agreement or understanding that iMGPFM will provide individual advice to any investor or advisory client in receipt of this document. Certain information constitutes “forward-looking statements” and due to various risks and uncertainties actual events or results may differ from those projected. Some information contained in this report may be derived from sources that we believe to be reliable; however, we do not guarantee the accuracy or timeliness of such information. Investing involves risk, including the potential loss of principal. Any reference to a market index is included for illustrative purposes only, as an index is not a security in which an investment can be made. Indexes are unmanaged vehicles that do not account for the deduction of fees and expenses generally associated with investable products. A list of all recommendations made by iMGPFM within the immediately preceding one year is available upon request at no charge. For additional information about iMGPFM, please consult the Firm’s Form ADV disclosure documents, the most recent versions of which are available on the SEC’s Investment Adviser Public Disclosure website (adviserinfo.sec.gov) and may otherwise be made available upon written request.
Certain material in this work is proprietary to and copyrighted by iM Global Partner Fund Management, LLC and is used by OJM Group with permission. Reproduction or distribution of this material is prohibited and all rights are reserved.
For informational purposes only. OJM Group, LLC is an investment adviser registered under the Investment Advisers Act of 1940. Registration as an investment adviser does not imply any level of skill or training. For more information about OJM Group please visit https://adviserinfo.sec.gov/ or contact us at 877-656-4362. Not intended as legal or investment advice or a recommendation of any particular security or strategy. Information prepared from third-party sources is believed to be reliable though its accuracy is not guaranteed. Investing involves risk and possible loss of principal capital. Past performance is not indicative of future results.
Index Disclosure: An index is an unmanaged portfolio of specific securities, the performance of which is often used as a benchmark in judging the relative performance of certain asset classes. Investors cannot invest directly in an index. An index does not charge management fees or brokerage expenses, and no such fees or expenses were deducted from the performance shown. Index returns shown are price returns, which exclude dividends and other earnings.

