
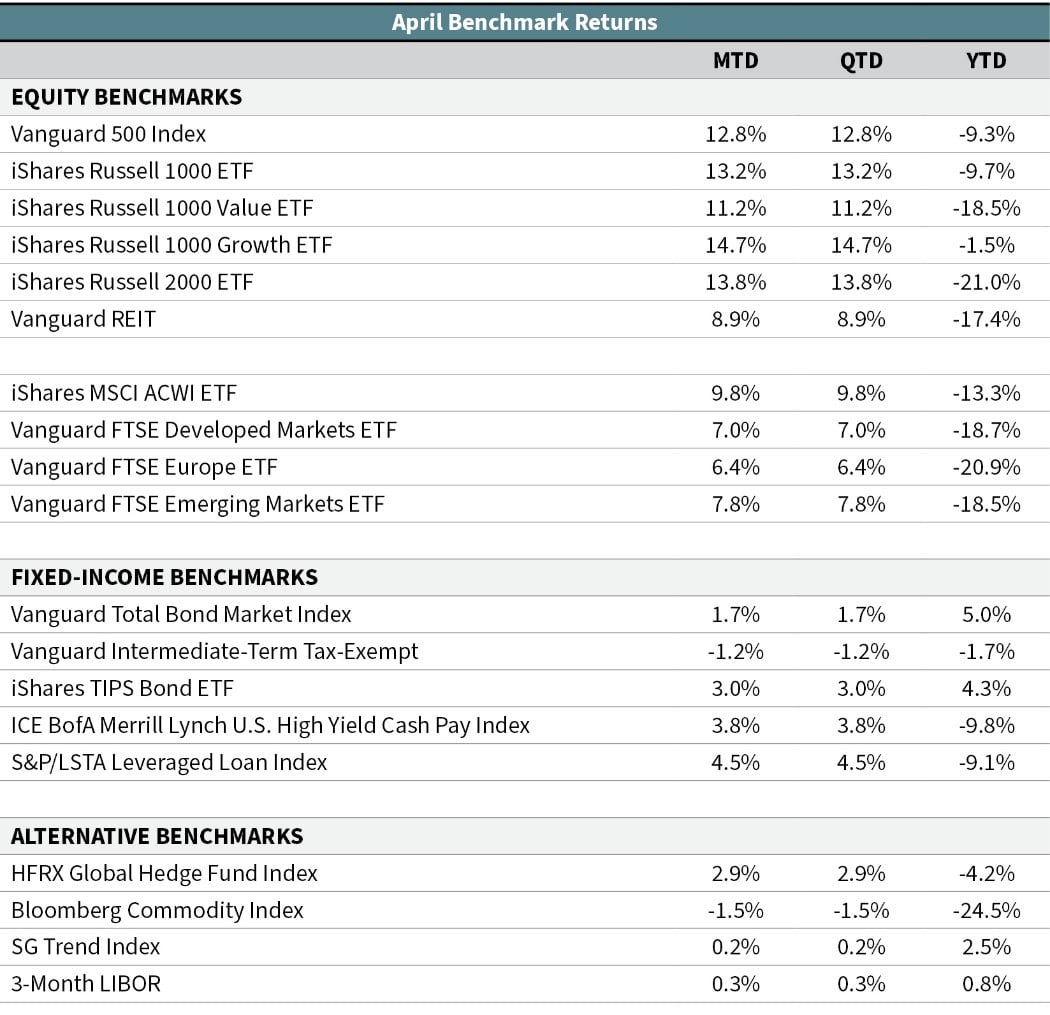
We noted in our first quarter commentary that the speed of the market drop in March was historic. The U.S. stock market fell 20% in just 22 days and fell 30% in 30 days. But since March 23, the market has moved in the other direction at the same breakneck speed—rising more than 30% through the end of April. Larger-cap U.S. stocks gained 12.8% in April, their best monthly gain since 1987 and the third-highest gain post 1950 (Vanguard 500 Index). International equity markets also rose last month but not at the same pace as U.S. stocks. Developed international stocks returned 7.0% in April (Vanguard FTSE Developed Markets ETF), with European stocks gaining 6.4% (Vanguard FTSE Europe ETF). Emerging-market stocks gained 7.8% last month (Vanguard FTSE Emerging Markets ETF).
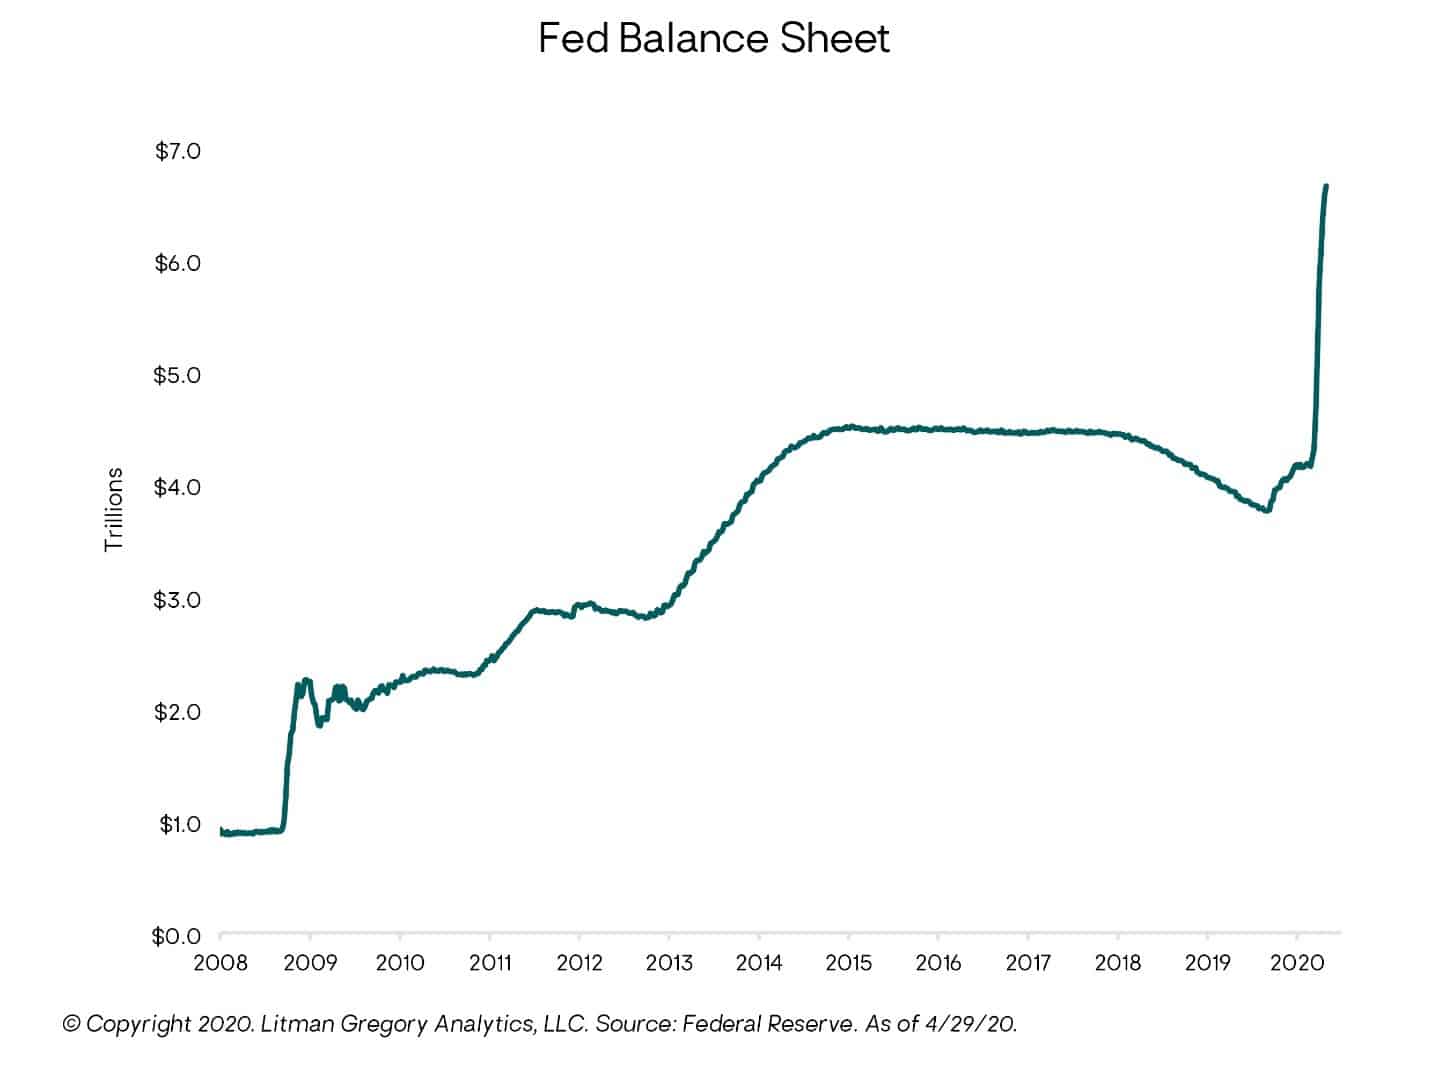
U.S. stocks are now down “only” about 13% from their all-time highs a little over two months ago. The reversal in the stock market can mostly be attributed to slowing COVID-19 cases in many major economies and central bank policy actions. Globally, central banks have lowered interest rates and flooded the markets with liquidity. In the United States, the Federal Reserve has stepped in to purchase pretty much everything. Their balance sheet has skyrocketed upward since March and is nearing $7 trillion (see chart on the next page). In the six weeks ending in April, the Fed added $2 trillion to their balance sheet. For comparison, they added $2 trillion over a three-year period between 2008 and 2011. We are seeing “unprecedented” Fed actions taken to a whole new level in this crisis.
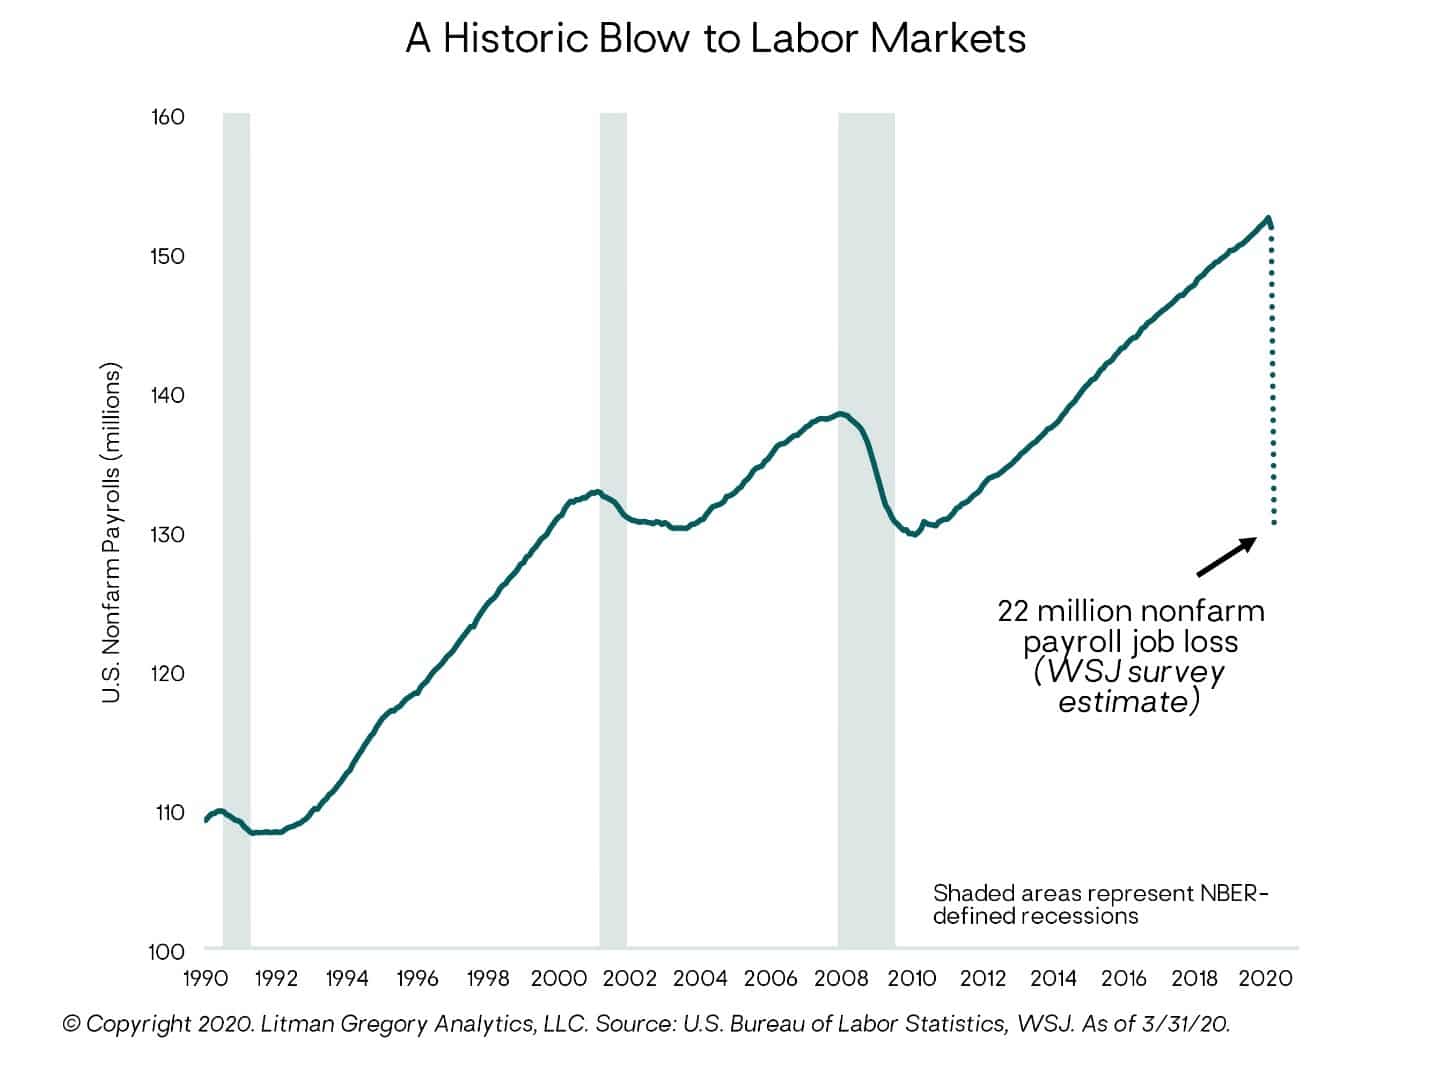
While the stock market has reversed course and now looks to be implicitly pricing in a V-shaped economic recovery given the speed at which it’s risen, there are still many questions to be answered about the economy. The economic damage has been horrific. This global pandemic led to a sudden and deliberate stop of economies around the world—something governments, businesses, and consumers were largely unprepared for given its lack of historical precedence. Tens of millions have lost their jobs in the United States and the destruction is expected to lead to the steepest drop in GDP in our lifetimes in the second quarter. The equivalent of the last decade’s total gains in the jobs market was wiped out in April. But investors had already discounted this news and were looking beyond it to the eventual economic rebound, which is why the stock market retraced a large portion of its losses since March despite the release of terrible economic data.
U.S. stocks are now down “only” about 13% from their all-time highs a little over two months ago. The reversal in the stock market can mostly be attributed to slowing COVID-19 cases in many major economies and central bank policy actions. Globally, central banks have lowered interest rates and flooded the markets with liquidity. In the United States, the Federal Reserve has stepped in to purchase pretty much everything. Their balance sheet has skyrocketed upward since March and is nearing $7 trillion (see chart on the next page). In the six weeks ending in April, the Fed added $2 trillion to their balance sheet. For comparison, they added $2 trillion over a three-year period between 2008 and 2011. We are seeing “unprecedented” Fed actions taken to a whole new level in this crisis.
As investors assess the near-term damage to the economy, they will grapple with the path of the recovery. If the global economy can reopen and return to some sort of normalcy before additional damage is done—and without a meaningful “second wave” of infections forcing renewed shutdowns again later in the year—then the sharp recovery in equity markets may prove prescient. But if the economy must remain closed, leading to more businesses permanently shuttering, and the expectation of a sharp uptick in GDP in the second half of 2020 doesn’t come to fruition, then equity markets just 13% below their all-time highs may need to re-price a different outlook. As we saw in February and March, assets priced for overly optimistic scenarios are subject to sudden and sharp declines when there is news that conflicts with the market’s outlook.
In the fixed-income markets, U.S. Treasury rates were largely unchanged in April. But credit spreads continued to come down from levels not seen since the financial crisis. High-yield spreads shot up to almost 1,100 basis points in late March before the Fed stepped in to bring calm back to the market. News of the Fed’s willingness to purchase below-investment-grade debt and ETFs was another lifeline for the credit markets. High-yield spreads have since crept back below 800 bps, leading to a more than 13% gain for high-yield bonds since March 23 (ICE BofA Merrill Lynch U.S. High Yield Cash Pay Index). Narrowing spreads in other areas of the bond market helped the U.S. core bond index outpace U.S. Treasuries with gains of 1.7% and 0.3%, respectively (Vanguard Total Bond Market Index and iShares 7-10 Year Treasury ETF). Floating-rate loans gained 4.5% for the month (S&P/LSTA Leveraged Loan Index).
—OJM Group Investment Team